Edit shape properties
Use the Drawing Tools to manage shapes as collections of polygons, points, and lines.

When you draw a shape, a record is added to Drawing Tools grid on the appropriate tab (Polygons, Lines, or Points). The following screen capture shows you the record for the polygon drawn on the map.
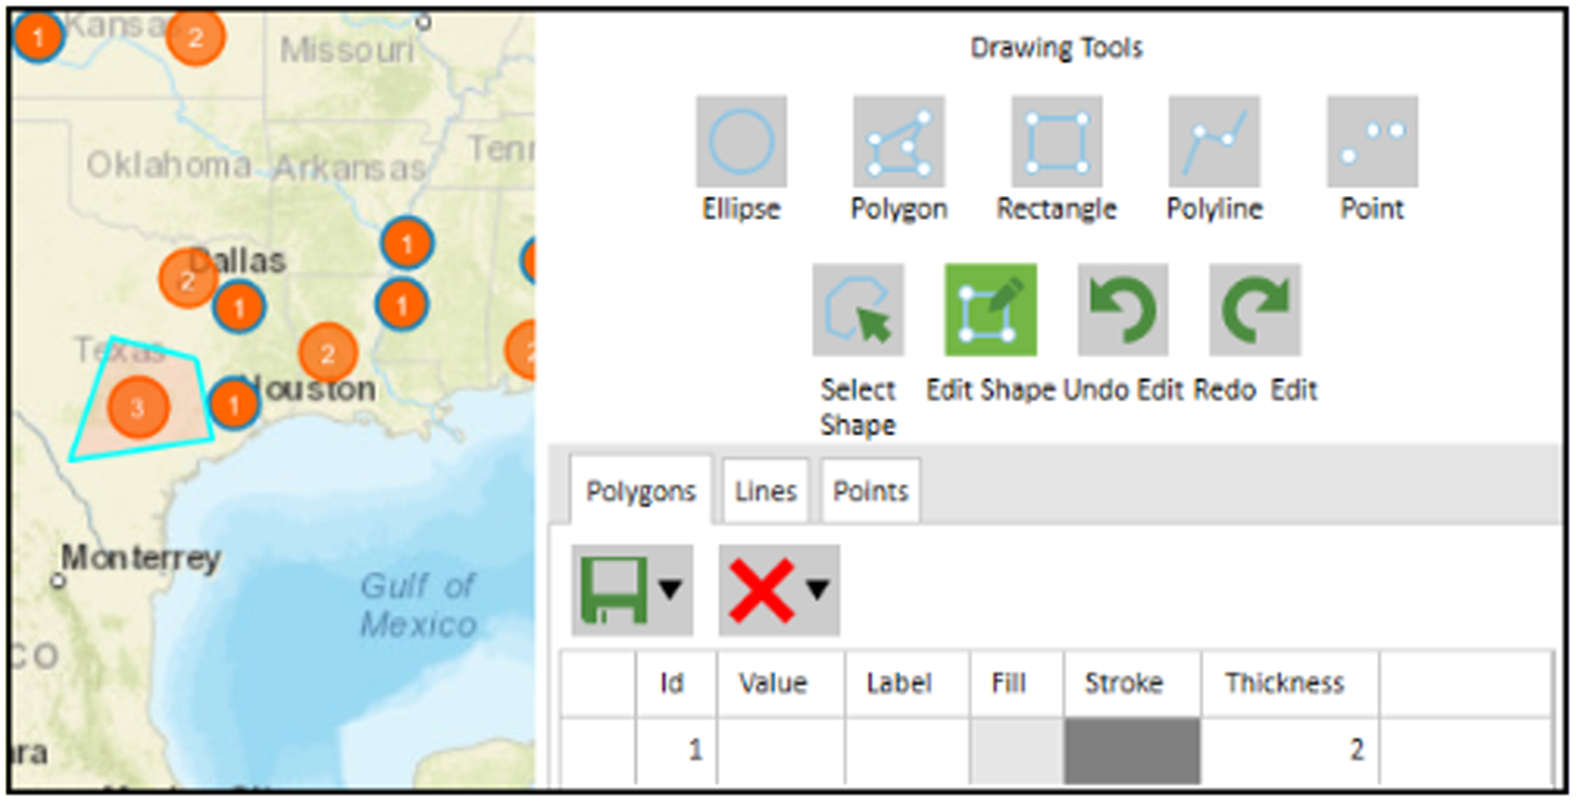
You can modify the properties of drawn shapes by editing values in the grid. When you select a shape, the associated Polygons or Lines or Points tab is selected with the grid populated with the data for the selected shape. For example, select a polygon shape. The Polygons tab displays the value, label, fill, stroke, and thickness values for the shape. For Fill and Stroke data, click in the cell to open the Color Palette window where you can change colors and the transparency (Alpha) level. For Value, Label, and Thickness, enter values in the cell. After editing the values, click the shape to see the edits. For example, on the Polygons tab, click in the Stroke field, select a color, and then click in the shape. You can select a shape by clicking the shape on the map or by selecting one or more rows on any of the tabs in the grid.