
Case study: 1999 ETC season
These case studies review historic storms in 1999 that affected Europe, their implications for excess demand for reconstruction, and the impact on costs following the events.
In December 1999, Europe was hit by three powerful storms that were individually deadly and collectively catastrophic. Anatol hit Northern Europe on December 3 and was followed a few weeks later by Lothar and Martin. Anatol had wind gusts of up to 185 km/h when it reached the German Bight and southern Denmark. On December 26, Extratropical Cyclone Lothar hit the Brittany coast in France and just nine hours later had created a path of destruction across northern France. One day later, about 200 km south, ETC Martin battered areas near Bordeaux, Biarritz, and Toulouse. France was hit extremely hard, but heavy damage also occurred in other regions.
The figure below shows the storm damage in the left panel with the relative concentration of damage at the sub-national level. The damage map is overlaid with the three major storms’ tracks that year also highlighting the areas of greatest impact. For Lothar and Martin, more than 65% of the losses are in France, which means that the demand surge in that country will determine how demand surge is viewed for the whole event.
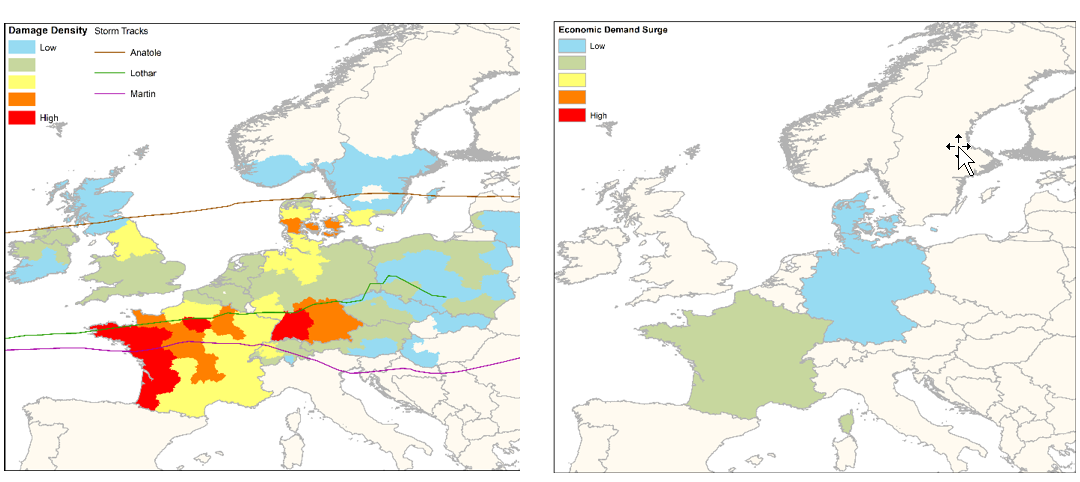
Although the events were widespread, economic demand surge occurred primarily in France. The right panel shows the relative country-level GDSM impact for all three events.
The following table shows the supporting data for the two countries that are most affected by these three events—France and Denmark. This includes the assumption of using 3% as a general construction labor inflation, and long-term materials cost inflation proxy for demand surge, as above; anything beyond that can be attributed to local variation. We can see that for France, the model predicts about a 6% increase in prices after these events. Contrast this with the lower 4% increase in Denmark. The moderate increase in France is indicated by yellow; elsewhere the predicted demand surge drops down to values that are consistent with no or minimal local effects and no increases in cost inflation like those in Denmark.
For construction statistics we used the construction repair index from France and Denmark; in addition, we can see that the PPI comes in at a similar level for both countries at about 5%. It is important to note that the CPI is the weighted average of most other prices, so it is quite low at 1% relative to the PPI in France; while the PPI is increasing, most other prices are remaining stable or flat.
| Country | GDSM | PPI | CPI | National construction statistics |
|---|---|---|---|---|
| France | 6% | 5% | 1% | 5% |
| Denmark | 4% | 4% | 2% | 5% |