
Developing global economic demand surge
Understanding demand surge in Europe requires identifying significant catastrophe events and analyzing post-event price data to assess their impact on construction costs.
The model relies on proxy datasets, wage differentials, and regional cost indices to estimate the relative contributions of labor and materials.
Understanding demand surge in a region starts with having a known catastrophic event significant enough to disrupt construction market equilibriums for labor, materials, or both. It also requires having a time series of price data after the event to understand the magnitude of the impact of local effects and cost inflation. Finally, it helps to know if the relative cost of labor is high enough that local effects need to be considered.
In the U.S., data exists to directly measure the input proportions that labor and material contribute to the unit cost of construction. In Europe, the proportion must be imputed from the available datasets. In Figure 1, the bar chart on the left shows the relative construction wage rates for the bottom 5, and top 5 countries in Europe. This data comes from the last wage survey conducted by Eurostat. Lower hourly wages are found in Eastern European countries; the higher hourly wages are found in Western European countries. The highest hourly wages are close to the U.S. average. The differential between these two groups is quite significant, but it needs to be placed in context.
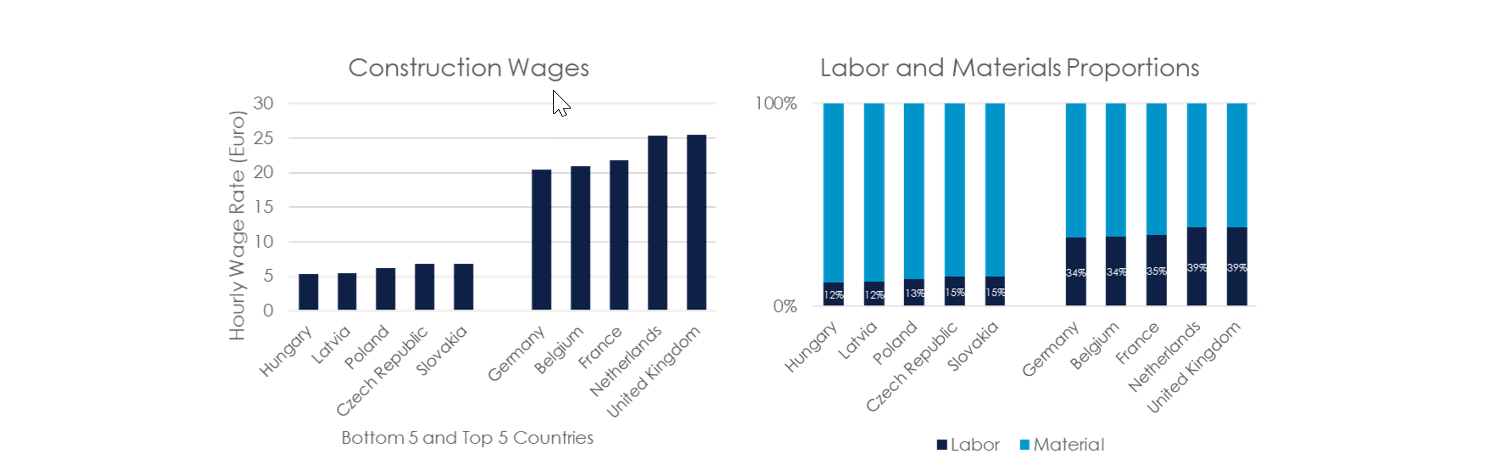
In the chart on the right of the figure above, the relative contribution of labor to the total construction cost for each group of countries. These proportions were calculated by assuming the same structure is being built in each country. It would take the same number of person hours and the materials costs are typically constant across each country. For the higher wage countries, the cost of labor makes up a larger proportion of the value of the work. If the labor cost were to increase 10% in all countries, it would contribute about 4% to the increase in cost in the UK and about 1% in Hungary. The takeaway is that all the countries are likely to be affected by construction materials demand surge; on top of that, higher wage countries are going to be affected by a more localized labor demand surge effect.
Beginning in 2000, construction cost index data is available for the EU as a whole and can be used to create a distribution of annual cost changes similar the data used for the initial development of the GDSM using U.S. data.
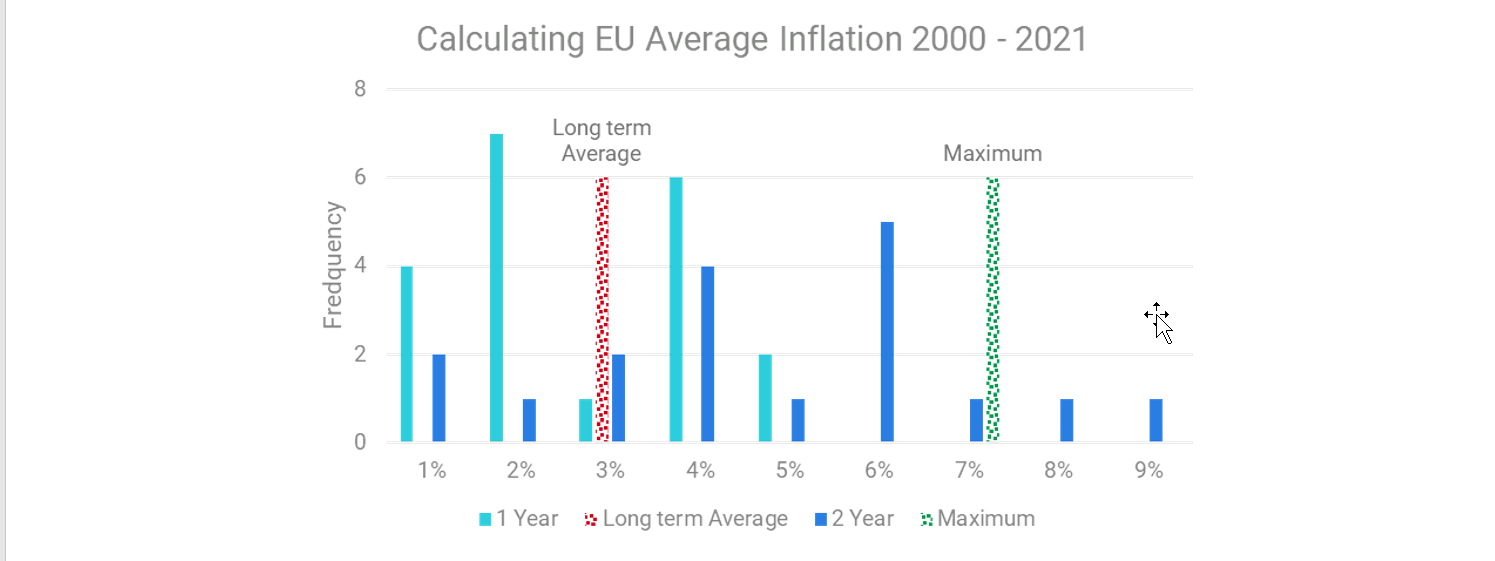
The figure below shows the 1- and 2-year frequency distribution of annual inflation for Europe. The 1-year distribution is in teal and the 2-year distribution is in blue. The long-term average is indicated by the red bar and the current maximum is indicated by the green bar. The average annual changes in Europe are not as dramatic as the U.S., where the average and maximum values are about double the magnitude. For events happening after 2000, these changes can be used to measure market disruption as a part or regional aggregate demand and current economic conditions.
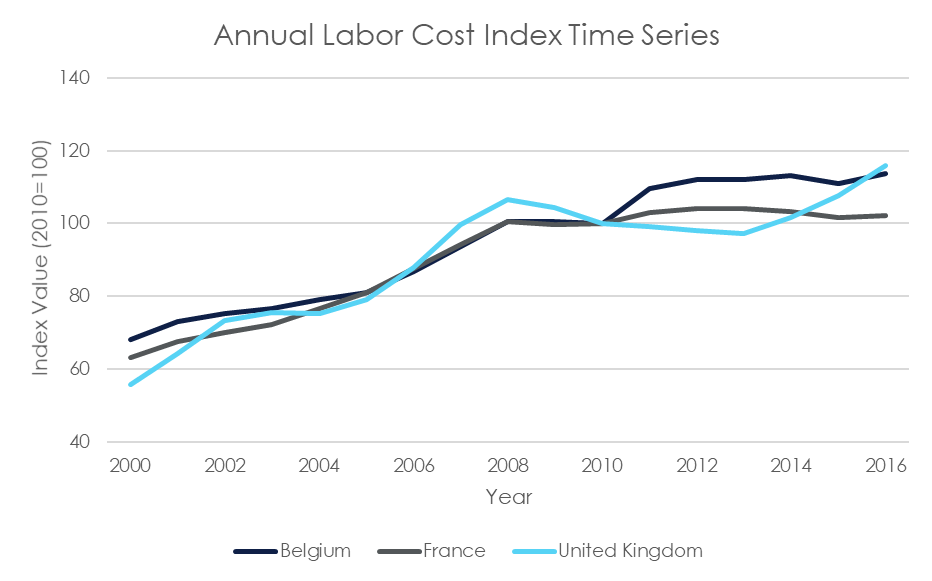
We also need to know which historical events were likely to have caused demand surge, and the labor and materials cost time series that cover those events. The next figure shows the available construction labor cost data from Eurostat starting in 2000 for a sample of countries. This data can be used to explore what happened in 2007, after an extratropical cyclone, Kyrill, tore across a wide swath of Europe in January.
Before that we would have to go back to 1999 to find significant demand surge–causing events for a European extratropical cyclone, such as Anatol, Lothar, and Martin. Because the Eurostat index begins the year after these three storms struck, we looked for other datasets from the statistics department of each country affected to fill in the gaps.
The table below lists the most available prices indexes and how they can be used as proxy data. The preferred data set is the construction cost index because it considers labor and materials costs and will give the most relevant comparison, but the data availability is limited the further you go back in time. In addition, the producer price index can be used as a proxy for building materials. Finally, the consumer price index can be used for industrialized countries when no other index is available, but we have seen instances where the construction cost index and consumer price index diverge significantly.
| Index name | Labor cost | Materials cost |
|---|---|---|
| Construction cost index (CCI) | X | X |
| Producer price index (PPI) | X | |
| Consumer price index (CPI) | X | X |