
Validation of the demand surge function
Validation of the demand surge function is constrained by the limited availability of historical data especially for extreme events, requiring reliance on expert judgment and supplementary evidence to support the function’s applicability.
In addition to internal peer review and analyses such as those presented here, the Verisk demand surge function has been reviewed and meets the demand surge standard of the Florida Commission on Hurricane Loss Projection Methodology. It has also been reviewed by rating agencies as part of the due diligence they perform with respect to insurance-linked securitizations, or catastrophe bonds.
We used construction cost time series data available following the U.S. hurricanes of 2004 and 2005 to validate the demand surge function. The fact that there have been no major damaging earthquakes in the U.S. in recent years and thus no recent data on associated changes in local labor and materials costs makes explicit calibration of the demand surge function to the earthquake peril challenging.
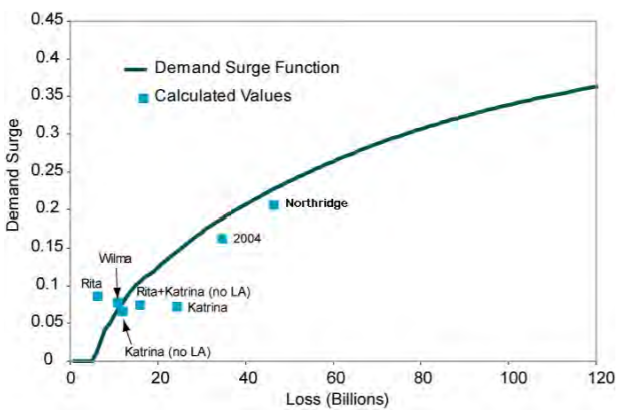
There is anecdotal evidence, however, that would suggest the reasonability of the Verisk demand surge function for use with the Verisk Earthquake Model for the United States. Following the Northridge earthquake of 1994, the California Earthquake Authority testified that insurers had reported price inflation of 20% in the wake of that event. 1
If the Northridge earthquake event were to recur today, Verisk’s estimate of insurable industry losses would be $49 billion, which corresponds to a demand surge factor of roughly 21% using the current function. Indeed, there is no evidence to suggest that the demand surge function is peril specific. Demand surge is fundamentally an economic phenomenon; while there may be some differences in the types of materials and labor required for repair and rebuilding, these should have a relatively small impact on overall price inflation in the aftermath of a catastrophe.
Sample analysis to validate demand surge for coverage A and B
The construction cost time series data from the 2004 and 2005 U.S. hurricane seasons allowed us to isolate the changes in the costs of individual building components due to each storm and, subsequently, to determine how each component contributed to the demand surge as it relates to Coverage A and B losses.
The construction cost data came from XactAnalysis™, a reporting tool created by Xactware. XactAnalysis offers Industry Trend Reporting, which provides construction labor and material cost information over time. Verisk-obtained quarterly data for the labor and material breakdowns shown below. The data were used to analyze the effects of the 2004 Hurricanes Charley, Jeanne, Frances, Ivan, and the 2005 Hurricanes Katrina, Rita and Wilma.
|
Labor |
Material |
|---|---|
|
Roofer |
Roofing material |
|
Carpenter |
Lumber |
|
Drywall installer |
Drywall materials |
|
Flooring installer |
Carpet |
|
Demolition laborer |
|
|
Electrician |
|
|
Plumber |
Material and labor cost changes
Trend data on material and labor costs is monitored on an ongoing basis. After an event, the change in cost for each material and labor category in each geographic area was calculated for:
- the quarter in which the storm made landfall
- the following three quarters
In an attempt to isolate the effect of the storms on construction costs from other effects, the change in U.S. average cost for each data category for the corresponding time period was subtracted from the cost change for the storm-affected region.
Composition of damage at the county level
To estimate demand surge at the county level (the resolution most closely matching the resolution of the XactAnalysis data), Verisk engineers first estimated how physical damage from the storms was distributed across six building components: roof covering, roof sheathing, windows and doors, interiors, exterior walls, other (e.g. plumbing, electrical). The estimated physical damage to each component was then translated into a dollar amount by applying a damage ratio to the replacement cost of the component. Each component’s repair cost was then calculated as a share of the total repair cost for the building.
Material and labor breakdown by category
Because demand surge affects materials costs and labor costs differently it was then necessary to determine the breakdown of repair costs between materials and labor for each building component. For example, it is estimated that 29% of the repair cost of replacing roof covering is attributable to materials and 71% is attributable to labor.
Weighted demand surge by county
Based on the information gathered thus far—the change in component costs from XactAnalysis, the share in total repair costs of each component, and the labor/materials breakdown for each component—a weighted demand surge estimate can be determined for each county.
Using the top loss-producing counties, the aggregate demand surge for each storm was calculated as a weighted combination of the county-level demand surge factors, with weights determined by the share of the modeled county loss in total losses. Note that “aggregate demand surge” refers to the inflationary pressure caused by the combined effects of storms that occurred in close temporal and geographical proximity.
For each event, the demand surge for Coverage A and B was calculated for the quarter the storm made landfall, and for the next three quarters (essentially to the beginning of the following hurricane season).
Cumulative demand surge by event
To determine the demand surge for each event, the cumulative demand surge for each quarter was weighted using the percentage of total claims paid during that quarter. The cumulative demand surge function was tested using the major storms of 2004—Charley, Frances, Ivan and Jeanne—which all made landfall in or near Florida within a 45-day period. The demand created by events that occur in such close proximity has a bigger impact on the regional economy than any single event taken independently.
Because of this, and because the XactAnalysis cost data is provided quarterly (therefore making it difficult to isolate the effects of individual storms), Verisk took the additional step of calculating a single combined demand surge factor for the four storms together. This factor is simply a weighted combination of the aggregate demand surge of the individual storms, with weights equal to the share of each storm’s modeled loss in total losses for the four storms.
The figure 2 below shows the fit of the demand surge factors from recent historical events relative to the Verisk demand surge function. Note that the demand surge estimate for Katrina below does not include Louisiana. For a full discussion of the factors affecting the demand surge estimate for Katrina, please see the following section. Overall, given the low number of events, the data approximates the Verisk demand surge function reasonably well.
Hurricane Katrina
Hurricane Katrina was an unprecedented natural disaster in modern U.S. history, both in the scope and nature of the destruction it caused. The floods in New Orleans and its surrounding areas caused significant challenges to rebuilding in the days and weeks following the event. Furthermore, many areas of the city and its surroundings were sparsely or even completely uninhabited for months after the storm hit; some of these neighborhoods are still more or less abandoned today. Because the rebuilding in much of this area has happened gradually rather than being concentrated in a short period, Verisk did not observe the same spikes in labor and materials costs that would typically be associated with such events.
Evidence from a wide range of sources points to these factors holding down the demand for rebuilding resources in these areas. For example, on March 19, 2007, the trade publication Engineering NewsRecord ran a story about the delays associated with rebuilding following Katrina:
“[Southeast Louisiana Building and Construction Trades Council President Donald] Denese says many union members and leader had hoped that major reconstruction in the region would be underway by now, but delays in relief funds and insurance hassles have slowed developers plans. “We thought we’d be up and running by now, but it’s still crawling,” he says. “We’re ready to answer the call, but the call hasn’t come yet.”
In validating the demand surge function, and in particular, the estimates of demand surge for Katrina, Verisk has looked at the event from several perspectives. As there is little evidence to show that the rebuilding in Mississippi and Alabama moved at the same abnormally slow pace as the New Orleans area rebuilding, so Verisk also estimated demand surge for Katrina by looking at only Mississippi and Alabama losses and the associated changes in labor and materials costs in these areas.
Sample analysis to validate demand surge for coverage D
When a sudden, sharp increase in demand taxes the resources of a catastrophe-affected region, not only do the cost of materials and labor rise, but the time required to repair or rebuild damaged properties also increases. In the case of severe events that cause extensive and widespread damage, construction delays can be significant. The Verisk demand surge function accounts for potential delays in reconstruction due to labor shortages—delays that lead to increased time element, or Coverage D, losses.
To measure the effect of large events on time element losses, Verisk undertook an analysis of claims data for the major events of the 2004 and 2005 seasons. The analysis utilized data from a number of sources, including the Insurance Information Institute, ISO Property Claims Services, and the Bureau of Labor Statistics.
Based on estimates of damage ratios to individual buildings and estimates of available labor in the affected areas, Verisk construction engineers first calculated the average number of days required to complete repairs to a building to the point where additional living expenses or business interruption would no longer be paid out. These estimates were then combined with information on the total number of property claims to calculate the expected period of time it would take to make all repairs to all damaged buildings. This yielded an estimate of total time element losses that took into account the potential stresses on the labor market following a large catastrophe.
Finally, these figures were compared to the modeled time element losses for these storms. Verisk estimated that coverage D demand surge was approximately 21% for the 2004 season and 63% for Katrina. These estimates, point estimates of coverage D demand surge for these events, were used to measure and validate the relationship between coverage A and coverage D demand surge