Aggregation of industry losses from multiple events
Demand surge increases when multiple large events occur close together in time and location, as rebuilding from earlier events is still underway, leading to greater pressure on regional labor and resources.
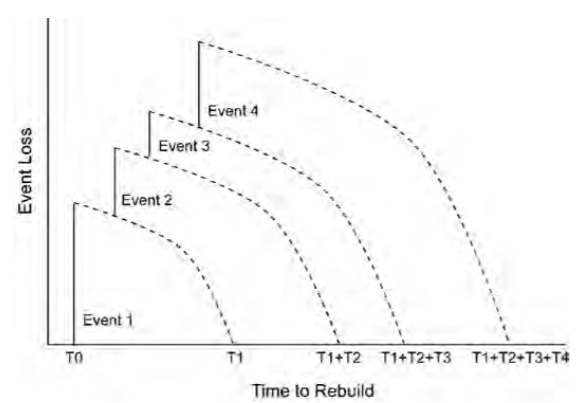
If a second large event hits the same region before rebuilding from the first has been completed, demand surge will be exacerbated. Therefore, in addition to the industry loss from any given event, the Verisk demand surge function considers industry losses from other events that occur in close geographic and temporal proximity
Regional aggregation
Data suggest that the sudden increase in reconstruction costs following a catastrophe event is driven primarily by the cost of labor. Labor is relatively immobile and labor markets tend to be regional, at least in the short term. Therefore, the pressure on labor resources caused by the increase in demand may not be felt in regions not immediately affected by the catastrophe event.
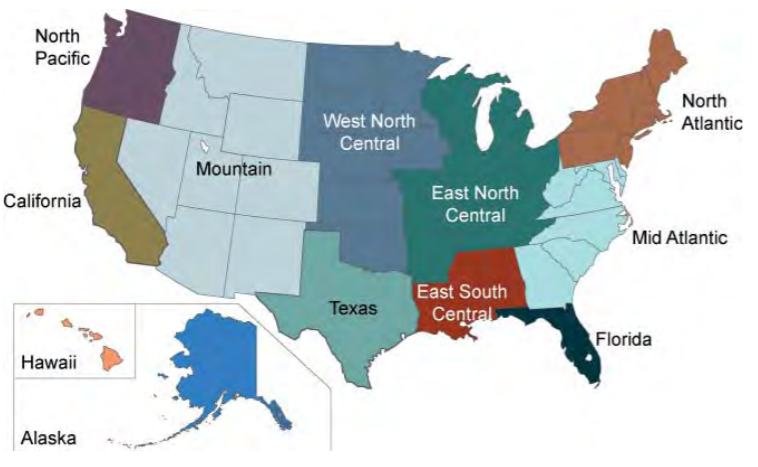
The notion of geographic proximity, as used by the Verisk demand surge function, is defined based on 12 U.S. regions. These divisions take into consideration factors such as distance, population concentrations, economic interdependencies, and hazard concentrations. We also considered differences in construction regulations and other insurance laws and policies followed by the various states.
Temporal aggregation
The effect on prices of a sudden, one-time increase in demand decreases with time. Therefore, what drives the aggregation of industry losses from events within a specific region is the length of time between the two events.
If two events occur in very close succession, there will have been little or no time to begin rebuilding before the second event occurs. In such cases, the Verisk demand surge function treats them as a single large event under the assumption that building materials were purchased, and labor contracted only after both events occurred. As the time between events increases, more of the rebuilding from the first event will have taken place; thus, the total effect on the economy will reflect whatever rebuilding remains from the first event, plus the additional demand from the second event.
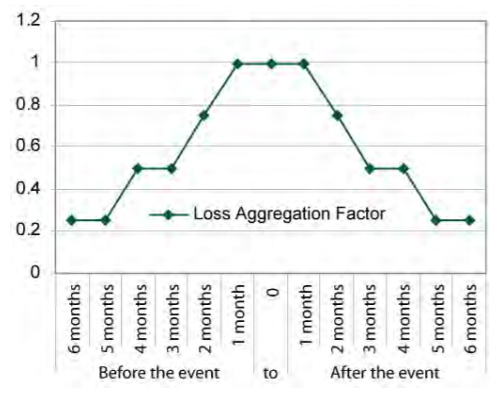
As events occur farther apart, their aggregate impact diminishes. This next figure shows the decay function used to aggregate the losses of events that occur in close proximity both temporally and geographically:
- Within 30 days of T0 = 100% of the losses aggregated
- 30 to 60 days of T0 = 75% of the losses aggregated
- 60 to 120 days of T0 = 50% of the losses aggregated
- 120 to 180 days of T0= 25% of the losses aggregated