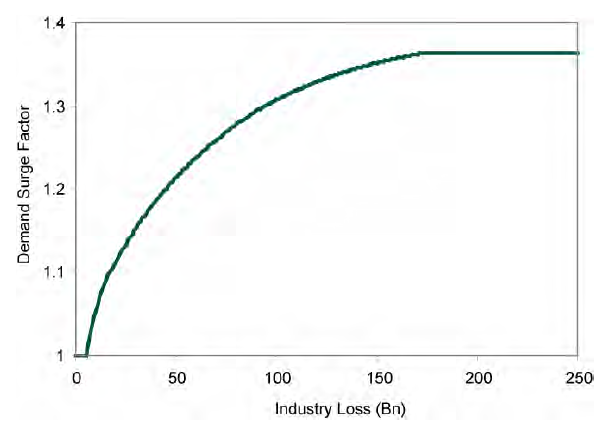
Coverage-specific demand surge
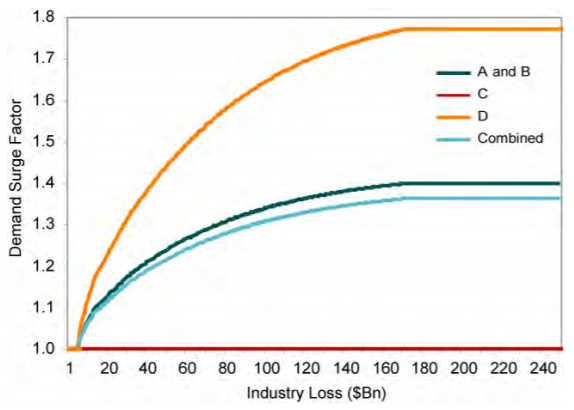
Demand surge varies across coverage types. Building-related coverages show increasing effects, contents remain largely unaffected, and time element losses increase at a significantly higher rate due to delays in reconstruction.
A combined demand surge function is derived by aggregating coverage-specific impacts to produce a unified aggregate loss estimate.
For example, our research and analysis indicates that as industry loss increases, time element losses increase at a rate exponentially higher than the demand surge function for Coverages A and B. The replacement cost of contents, on the other hand, has been shown to be virtually unaffected by demand surge.
Coverage A (building) and B (appurtenant structures)
The demand surge function for coverages A and B relates industry losses to a corresponding demand surge factor. Events with an industry loss of $5 billion or less have a demand surge factor of one (no increase). Once the $5 billion threshold is met, the demand surge factor increases rapidly for reasons discussed above. However, for larger loss amounts, the rate of increase slows and ultimately becomes constant as diminishing returns to labor set in.
Coverage C (contents)
Our analysis of claims data from the 2004 and 2005 hurricane seasons indicates that items insured under contents coverages do not see significant price increases following catastrophes. Therefore, Verisk’s demand surge function for coverage C is set to a factor of one at all levels of loss.
Coverage D (time element)
Time element losses can be particularly sensitive to demand surge. When there is widespread damage to property, low regional capacity to meet the increased demand can result in longer-than-normal repair times. This, in turn, results in greater business interruption losses and additional living expenses. Infrastructure damage, delayed building permit processes and a shortage of available building inspectors are also factors in increasing time element losses.
Our analysis indicates that as industry losses increase, coverage D losses increase at a significantly higher rate than for coverages A and B. Therefore, the demand surge factor applied to coverage D for all levels of loss above $5 billion is an exponential of the demand surge factor for coverages A and B.
All coverages combined
Coverages are combined into a single combined demand surge function. This curve was developed by first applying the relevant demand surge factors to Verisk modeled industry losses by coverage. Aggregating the losses across all coverage types with demand surge included and dividing the sum by the losses without demand surge yielded an estimate of the demand surge factor for each event. These factors by event were then matched with their respective modeled industry loss and smoothed to achieve a final curve that encompasses all coverage types. While the combined function does not provide resolution by coverage type, the results are reasonably stable between the two methodologies.