
Application of enhanced U.S. demand surge in the United States
This section summarizes the impact of demand surge on modeled industry losses for the U.S. tropical cyclone, inland flood, and winter storm models. All impact results represent the percent change in average annual or exceedance probability losses attributable to demand surge, computed as the difference between industry losses with and without the demand surge framework applied.
Impact of demand surge on average annual loss
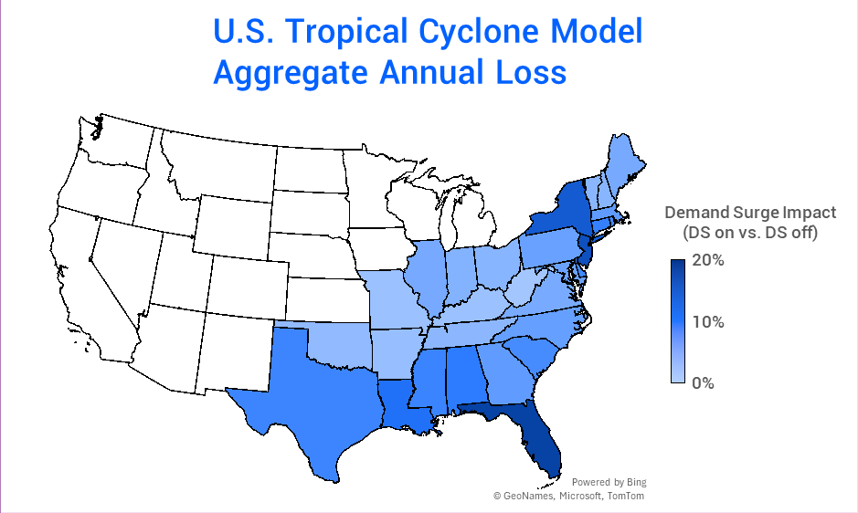
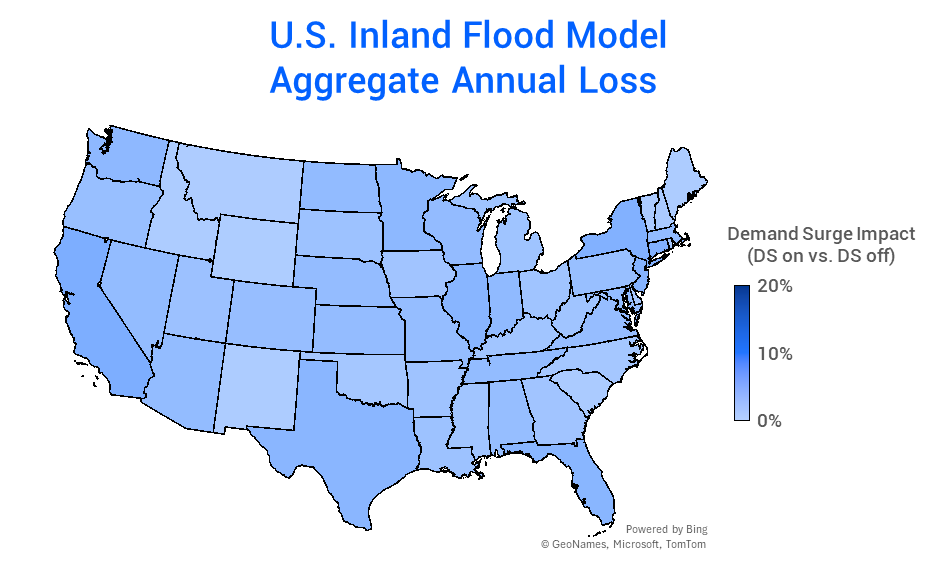
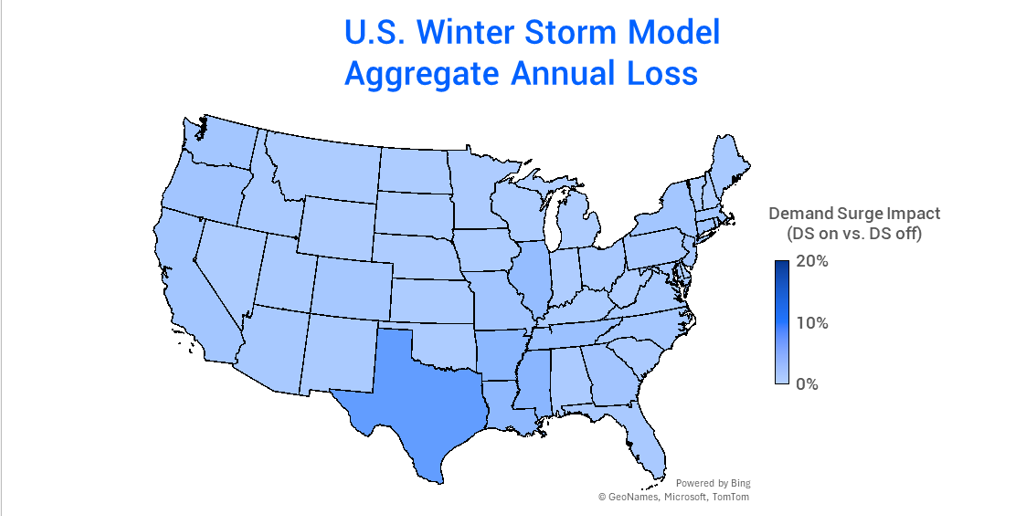
The following three figures show the impact of demand surge on average annual industry losses (AAL) by state for the tropical cyclone, inland flood, and winter storm models, respectively. The demand surge impact is presented as the percent change in modeled AAL for industry losses with demand surge applied relative to the baseline industry losses without demand surge.
Across all three models, the updated demand surge framework produces AAL impacts that are most pronounced in states with the highest modeled losses. This reflects both construction labor market disruptions and post-event construction cost inflation. Labor market disruption is triggered only when event losses exceed a minimum damage density threshold, and the post-event construction cost inflation contribution scales with the severity and duration of rebuilding activity. In general, states with lower average modeled losses experience correspondingly lower demand surge impacts, consistent with the empirical evidence that demand surge is predominant following more severe events.
Tropical cyclone AAL is the most sensitive to demand surge, followed by inland flood and then winter storm. This ordering reflects the differences in typical event severity, geographic concentration of losses, and rebuilding timelines across the three perils. Large tropical cyclone events, particularly those affecting densely populated coastal states, produce the concentrated labor market disruptions and extended rebuilding timelines that drive significant demand surge. In contrast, losses from inland flood events tend to be more dispersed geographically, moderating the labor disruption component while still producing post-event inflation impacts. Winter storm events typically have both minimal disruptions to the labor market and shorter claim settlement periods, resulting in the lowest average demand surge impacts across the three modeled perils.
Impact of demand surge by return period
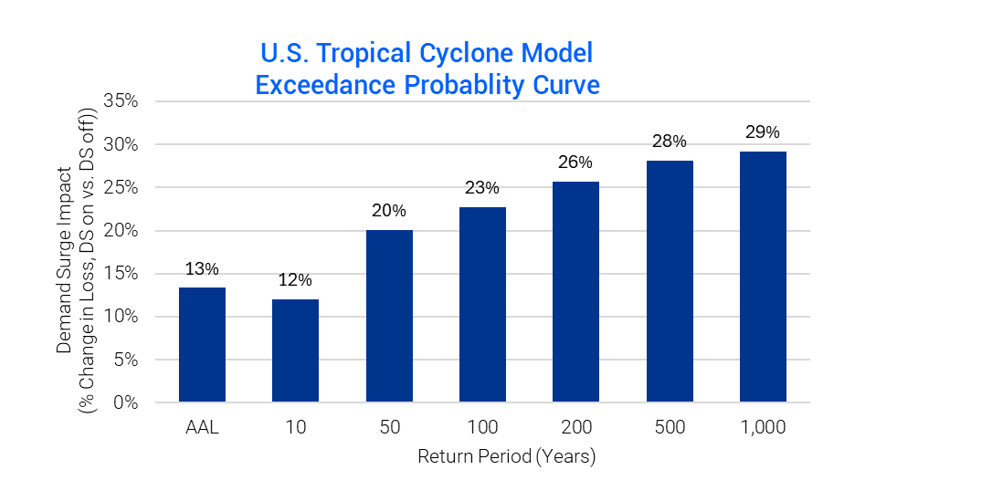
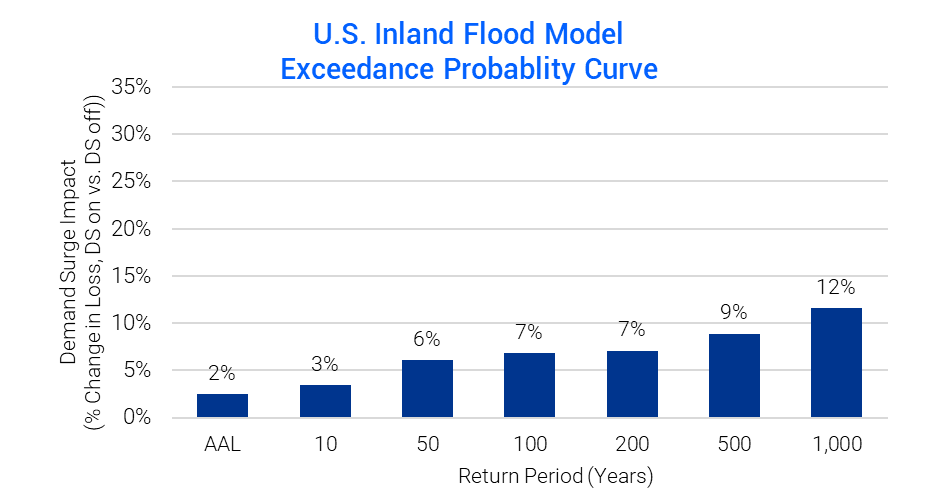
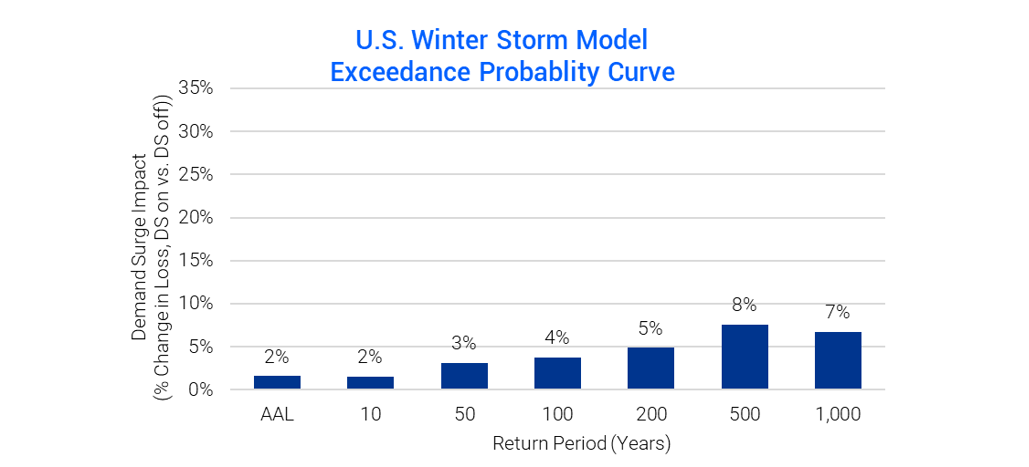
The figures below show the impact of demand surge on the exceedance probability (EP) curve for the U.S. as a whole, for the tropical cyclone, inland flood, and winter storm models, respectively. Demand surge effects increase with return period across all three models and are most apparent in large-loss years. This is consistent with the model's design: the labor disruption hazard component is activated for events only above a minimum damage density threshold, meaning that frequent, low-severity events contribute no labor market uplift, while less frequent, high-severity events trigger substantial labor disruption and extended reconstruction timelines.
Under the new framework, tail losses capture the localized construction disruptions that contribute to demand surge. High-return-period events show stronger state-to-state variation, as the geographic concentration of losses becomes more pronounced for the higher return-period events. EP curves reflect the impact of demand surge on industry losses. Portfolios with concentrated geographic exposure in high-risk states may therefore observe more pronounced tail impacts than the nationwide industry average would suggest.
Interpreting demad surge results
The demand surge impacts the potential industry loss increases for a given state, peril, and return period. Portfolio results will vary depending on portfolio composition, geographic concentration, and peril exposure. In general, the highest demand surge impacts occur in regions with the largest modeled losses, the highest density of damage and therefore potential claims, and the longest typical rebuilding timelines.
Several considerations are important for correctly interpreting model outputs:
- State-level impacts reflect industry loss results. Portfolio-specific results will differ based on the geographic distribution of insured assets, occupancy mix, and coverage structures. Portfolios concentrated in high-loss states will experience higher demand surge impacts than diversified or national portfolios.
- Users may adjust the inflation assumptions to reflect current construction market conditions or other factors affecting post-event construction cost inflation. The default parameters reflects the long-term average.
- Demand surge does not address undervaluation of insured property. Users should ensure that exposure replacement cost values are current before applying demand surge. Verisk Inland Flood Model for the United States (Source: Verisk 360Value can be used to update exposure costs prior to applying the demand surge framework.
Conclusion
Based on observations of historical events, demand surge is a meaningful driver of catastrophe losses, and that the impact of demand surge can vary by peril and the size and location of each event. The component-based approach that models the two primary economic drivers of demand surge: local labor market disruption and post-event construction cost inflation over the claim settlement period. By calibrating these components at the state and peril level, the model provides high-resolution insights into demand surge potential.